Data & Reports
Evidence-Based ApproachWorldWaterChain is built on internationally recognized data and official reports produced by multilateral organizations, public institutions, and scientific bodies.
This section provides transparency on the sources, indicators, and analytical frameworks informing the project.
Key Global Indicators
Global Water Indicators: A Snapshot of a System Under Pressure
The global water challenge is no longer abstract.
It is measurable, documented, and repeatedly confirmed by international reference reports.
The following indicators provide a factual overview of the current state of global water systems. They are drawn exclusively from official multilateral sources, including the United Nations World Water Development Reports and United Nations Sustainable Development Goal Reports.

2.2 billion people lack access to safely managed drinking water services
Despite decades of international commitments, access to safe drinking water remains uneven.
According to United Nations data, 2.2 billion people worldwide still do not have access to safely managed drinking water services.
This includes populations relying on unsafe sources, intermittent supply, or inadequate infrastructure.
Source: United Nations World Water Development Report; UN-Water; SDG 6 Progress Reports
3.5 billion people lack safely managed sanitation
Water challenges extend beyond drinking water.
Globally, approximately 3.5 billion people do not have access to safely managed sanitation services, increasing risks related to public health, environmental contamination, and waterborne diseases.
Source: United Nations World Water Development Report; WHO/UNICEF Joint Monitoring Programme
Over 50% of the global population experiences water scarcity at least one month per year
Water scarcity is not limited to traditionally arid regions.
More than half of the world’s population lives in areas that experience water scarcity for at least one month annually, due to seasonal variability, overuse, or infrastructure limitations.
This figure highlights the growing exposure of populations to water stress, even in regions historically considered water-secure.
Source: United Nations World Water Development Report; UN-Water
Agriculture accounts for approximately 70% of global freshwater withdrawals
Water use patterns remain highly unbalanced.
Globally, around 70% of freshwater withdrawals are attributed to agriculture, followed by industry and domestic use.
This concentration increases vulnerability to climate variability and places significant pressure on water systems.
Source: FAO; United Nations World Water Development Report
Climate change is intensifying both floods and droughts
Climate change acts as a multiplier of water-related risks.
International assessments confirm that climate change is increasing:
-
the frequency and intensity of droughts,
-
the occurrence of extreme rainfall events,
-
and the unpredictability of water availability.
These dynamics place additional stress on water infrastructure originally designed for more stable conditions.
Source: United Nations World Water Development Report; IPCC water-related assessments
Groundwater supplies nearly half of global drinking water
Groundwater plays a critical but often invisible role.
Approximately 50% of global drinking water comes from groundwater sources, yet these resources are frequently over-exploited, insufficiently monitored, or poorly governed.
The invisibility of groundwater contributes to delayed responses and long-term sustainability risks.
Source: United Nations World Water Development Report 2022 – Groundwater
Water-related disasters account for a majority of natural disasters worldwide
Floods, droughts, and storms linked to water systems represent the most frequent natural disasters globally, causing widespread economic losses and human displacement.
Water-related hazards increasingly intersect with urbanization, infrastructure vulnerability, and climate change.
Source: United Nations World Water Development Report; UN Office for Disaster Risk Reduction
A growing financing gap in water infrastructure
Despite the scale of the challenge, investment in water infrastructure remains insufficient.
International reports highlight a significant gap between required and actual financing for water supply, sanitation, and resilience infrastructure—particularly in low- and middle-income regions.
This gap directly affects the capacity to translate policy commitments into operational systems.
Source: United Nations World Water Development Report; SDG Financing Reports
From Indicators to Action
These indicators do not reflect a lack of knowledge.
They demonstrate that:
-
the challenges are clearly identified,
-
the risks are quantified,
-
and the consequences are well understood.
Yet, progress remains uneven because data, financing, infrastructure, and accountability mechanisms are not sufficiently connected.
This disconnect between global indicators and local execution forms the core challenge that WorldWaterChain seeks to address.
Note on Sources
All figures presented in this section are derived from:
-
United Nations World Water Development Reports (2003–2025),
-
United Nations Sustainable Development Goal Reports,
-
UN-Water consolidated indicators,
-
and associated multilateral reference frameworks.
International Reference Reports
A Global Knowledge Base Already Exists
The global water challenge is not the result of missing information.
On the contrary, it is one of the most extensively documented issues at the international level.
For more than two decades, multilateral institutions, scientific bodies, and public agencies have produced a vast body of reports, assessments, and datasets describing:
-
the state of global water resources,
-
the risks associated with climate change,
-
inequalities in access to water and sanitation,
-
governance challenges,
-
and financing gaps.
WorldWaterChain is built upon this existing and authoritative knowledge base.
United Nations World Water Development Reports (WWDR)
The United Nations World Water Development Report, coordinated by UN-Water and led by UNESCO, constitutes the primary global reference on freshwater resources.
Published annually since 2003, the WWDR series provides:
-
consolidated global indicators,
-
regional and thematic analyses,
-
case studies,
-
and policy-relevant insights.
Key themes covered across editions include:
-
access to drinking water and sanitation,
-
groundwater governance,
-
wastewater reuse,
-
water and climate change,
-
nature-based solutions,
-
partnerships and cooperation,
-
water security and peace.
These reports form the analytical backbone of the WorldWaterChain framework.
Source: United Nations World Water Development Reports (2003–2025), UNESCO / UN-Water
UN-Water and Interagency Coordination
UN-Water serves as the coordination mechanism among United Nations entities dealing with water and sanitation.
Its role includes:
-
harmonizing indicators,
-
consolidating reporting frameworks,
-
and supporting progress tracking on SDG 6.
UN-Water’s assessments provide cross-sectoral perspectives linking water to health, energy, food security, climate, and urban development.
Source: UN-Water Analytical Briefs and Consolidated Indicators
WHO & UNICEF Joint Monitoring Programme (JMP)
The WHO/UNICEF Joint Monitoring Programme for Water Supply, Sanitation and Hygiene is the global authority for tracking progress on drinking water, sanitation, and hygiene services.
JMP datasets underpin:
-
SDG 6 monitoring,
-
national and regional reporting,
-
and evidence-based policy design.
WorldWaterChain relies on JMP data to ground its understanding of service levels, disparities, and infrastructure gaps.
Source: WHO/UNICEF JMP Reports
Sustainable Development Goal (SDG) Reports
The United Nations Sustainable Development Goal Reports provide annual assessments of global and regional progress toward the 2030 Agenda.
These reports highlight:
-
advances and setbacks in SDG 6,
-
interlinkages between water and other SDGs,
-
and structural challenges affecting implementation.
They offer a macro-level perspective essential for aligning initiatives with internationally agreed objectives.
Source: United Nations SDG Reports (2015–2025)
Climate and Water Assessments
Water-related impacts of climate change are addressed across multiple international assessment frameworks, including:
-
climate risk analyses,
-
adaptation and resilience reports,
-
and water-specific climate chapters.
These assessments consistently identify water as a primary transmission channel through which climate change affects societies, economies, and ecosystems.
Source: UN-coordinated climate and water assessments referenced in WWDR editions
Regional and Thematic Reports
In addition to global assessments, regional and thematic reports provide:
-
localized insights,
-
region-specific challenges,
-
and differentiated impact profiles.
These reports support:
-
contextualized decision-making,
-
prioritization of interventions,
-
and alignment with territorial realities.
WorldWaterChain integrates these perspectives to avoid one-size-fits-all approaches.
Source: Regional SDG Progress Reports; UNESCO and UN Regional Commissions
From Reports to Operational Coherence
Taken together, these reports demonstrate that:
-
the global diagnosis is clear,
-
the challenges are well-documented,
-
and the objectives are widely shared.
However, they also reveal a persistent gap between:
-
knowledge and execution,
-
strategic commitments and operational deployment,
-
global indicators and local impact.
WorldWaterChain positions itself within this gap, not to replace existing frameworks, but to connect data, infrastructure, financing, and accountability into a coherent operational system.
Note on Use of Sources
WorldWaterChain does not reinterpret or modify official data.
All references are used as contextual foundations, respecting:
-
institutional ownership of data,
-
methodological integrity,
-
and reporting sovereignty.
Maps & Visual Evidence
Seeing the Water Challenge: From Numbers to Spatial Reality
Data alone does not fully convey the complexity of the global water challenge.
Spatial visualization plays a critical role in understanding where pressures concentrate, how risks overlap, and which territories are most exposed.
Maps and visual evidence transform indicators into geographical realities, revealing patterns that are often invisible in aggregated statistics.
International reference reports consistently use cartographic analysis to illustrate:
-
disparities in access to water and sanitation,
-
levels of water stress and scarcity,
-
exposure to climate-related risks,
-
and regional vulnerabilities.
Global Water Stress and Scarcity Maps
Global water stress maps highlight regions where freshwater withdrawals approach or exceed available resources.
These visualizations reveal:
-
chronic stress in arid and semi-arid regions,
-
seasonal scarcity affecting densely populated areas,
-
and emerging stress zones driven by climate variability and demand growth.
Such maps demonstrate that water stress is no longer confined to a limited number of regions, but affects territories across all continents.
Source: United Nations World Water Development Reports; UN-Water global assessments
Access to Drinking Water and Sanitation
Maps illustrating access to safely managed drinking water and sanitation services expose stark territorial inequalities.
They show:
-
persistent gaps between countries,
-
significant disparities within national borders,
-
and contrasts between urban and rural areas.
These visual patterns underline the limits of national averages and emphasize the importance of localized solutions.
Source: WHO/UNICEF Joint Monitoring Programme; UN SDG Reports
Groundwater Dependence and Depletion
Cartographic representations of groundwater use highlight regions heavily dependent on aquifers for drinking water, agriculture, and industry.
These maps also reveal:
-
areas of intensive abstraction,
-
declining groundwater levels,
-
and regions where monitoring remains limited.
The invisibility of groundwater makes spatial visualization essential for informed governance and long-term sustainability.
Source: United Nations World Water Development Report 2022 – Groundwater
Climate-Related Water Risks
Climate and water risk maps illustrate the spatial overlap between:
-
drought-prone areas,
-
flood exposure,
-
glacier and snowmelt dependency,
-
and population density.
These visualizations confirm that climate change amplifies existing vulnerabilities and creates new risk configurations, particularly in regions dependent on seasonal water sources.
Source: United Nations World Water Development Reports; UN climate-related assessments
Why Maps Matter for Decision-Making
Maps do more than describe reality.
They support:
-
prioritization of interventions,
-
targeting of infrastructure investments,
-
coordination across administrative boundaries,
-
and communication with stakeholders.
By making risks and inequalities visible, maps help bridge the gap between global indicators and territorial decision-making.
Limitations of Static Visualizations
While essential, maps also have limitations.
They often:
-
represent snapshots in time,
-
mask rapid local changes,
-
and remain disconnected from real-time operational data.
This limitation reinforces the need for frameworks capable of linking spatial evidence with continuous monitoring, traceability, and execution mechanisms.
From Visual Evidence to Actionable Systems
Maps and visual evidence clearly demonstrate where challenges exist.
However, they do not, by themselves, ensure that action follows.
The next step lies in transforming:
-
visual diagnosis,
-
territorial insight,
-
and risk awareness
into operational systems capable of delivering measurable impact.
This transition—from seeing to acting—forms the foundation of WorldWaterChain’s approach.
Note on Sources
All cartographic references used by WorldWaterChain originate from:
-
United Nations World Water Development Reports,
-
UN-Water consolidated datasets,
-
WHO/UNICEF Joint Monitoring Programme,
-
and UN Sustainable Development reporting frameworks.
From Data to Action: When Knowledge Fails to Deliver Impact
Over the past decades, the global community has produced an unprecedented body of knowledge on water.
International organizations, governments, research institutions, and development agencies have extensively documented:
-
water scarcity and stress,
-
infrastructure gaps,
-
climate-related risks,
-
financing needs,
-
and social inequalities linked to water access.
Yet, despite this growing clarity, the gap between diagnosis and concrete impact remains significant.
A world rich in data
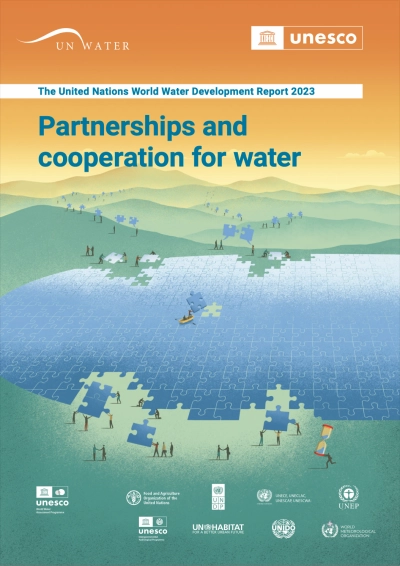
According to the United Nations World Water Development Report 2023,
2.2 billion people still lack access to safely managed drinking water services*, despite decades of global commitments and monitoring efforts.
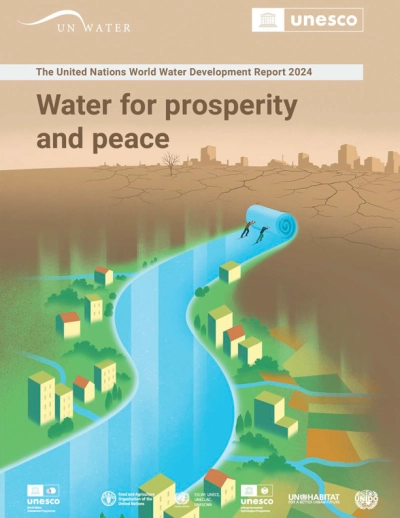
At the same time, between 3.5 and 4 billion people experience severe water stress at least one month per year*, exposing nearly half of humanity to recurring water insecurity
(UNESCO, World Water Development Report 2024 – Water for Prosperity and Peace).
These figures are not estimates in isolation.
They are the result of consolidated datasets, harmonized indicators, and multi-year reporting frameworks developed by UN-Water, UNESCO, WHO, and partner institutions.
Escalating pressure, well documented
The data also point to accelerating structural pressure.
The World Water Development Report 2015 projects that global water demand could increase by more than 55% by 2050*, driven primarily by:
-
population growth,
-
urban expansion,
-
and industrial development.
Climate-related risks further compound this pressure.
The World Water Development Report 2020 highlights that approximately 90% of natural disasters are water-related*, including floods, droughts, and extreme precipitation events.
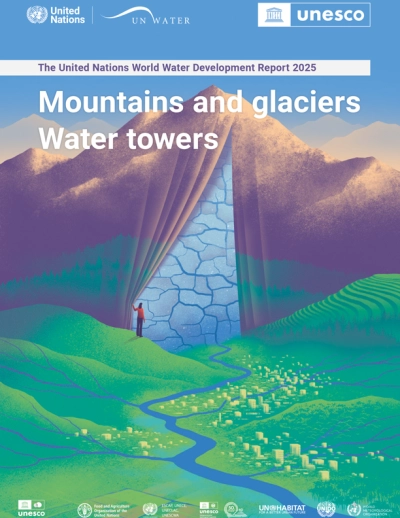
Meanwhile, 1.6 billion people depend directly on water originating from mountain regions and glaciers*, ecosystems that are increasingly threatened by climate change
(UNESCO, World Water Development Report 2025 – Mountains and Glaciers: Water Towers).
The execution gap
Despite the availability of robust data, the reports consistently identify a structural execution gap.
The World Water Development Report 2023 explicitly notes that:
progress is constrained less by the absence of knowledge than by limited coordination, fragmented governance, and insufficient mechanisms to translate commitments into measurable outcomes.
This disconnect is particularly visible in financing.
The World Water Development Report 2021 – Valuing Water estimates that the annual financing gap to achieve Sustainable Development Goal 6 amounts to hundreds of billions of US dollars*.
While funding commitments exist, the report underlines persistent challenges related to:
-
traceability of funds,
-
accountability of implementation,
-
and verification of real-world impact.
Indicators without territorial resolution
Another critical issue identified across multiple reports is the mismatch between global indicators and local realities.
The World Water Development Report 2019 – Leaving No One Behind emphasizes that national or global averages often mask significant subnational disparities*.
As a result:
-
progress reported at national level may coexist with severe local deprivation,
-
vulnerable populations remain invisible in aggregated data,
-
and investments fail to reach the areas of greatest need.
From evidence to execution
Together, these findings point to a central conclusion shared across the reports:
The global water crisis is not a crisis of information.
It is a crisis of execution, coordination, and accountability.
Data are abundant.
Diagnostics are clear.
Commitments are formalized.
What remains insufficient are frameworks capable of transforming data into action, and action into verifiable, durable impact.
This is the structural space in which WorldWaterChain positions itself—not to replace existing institutions or data producers, but to help bridge the gap between what is known, what is financed, and what is delivered on the ground.
Sources
* UNESCO / UN-Water – World Water Development Report 2023: Partnerships and Cooperation for Water
* UNESCO – World Water Development Report 2024: Water for Prosperity and Peace
* UNESCO – World Water Development Report 2015: Water for a Sustainable World
* UNESCO – World Water Development Report 2020: Water and Climate Change
* UNESCO – World Water Development Report 2025: Mountains and Glaciers – Water Towers
* UNESCO – World Water Development Report 2019: Leaving No One Behind
* UNESCO – World Water Development Report 2021: Valuing Water
Methodology & Transparency
Methodology & Transparency
An Evidence-Based and Verifiable Framework
WorldWaterChain is grounded in an evidence-based methodology built upon official international data, peer-reviewed institutional reports, and recognized multilateral monitoring frameworks.
The project does not generate proprietary statistics on global water conditions.
Instead, it relies on existing authoritative data, ensuring neutrality, comparability, and methodological integrity.
This section outlines how data are selected, interpreted, and integrated into the WorldWaterChain framework.
Primary Data Sources
WorldWaterChain draws its quantitative references primarily from:
-
UN World Water Development Reports (WWDR) — UNESCO / UN-Water
-
UN Sustainable Development Goals (SDG) Reports — United Nations
-
WHO / UNICEF Joint Monitoring Programme (JMP)
-
UNEP & FAO sectoral assessments
-
Regional UN Economic Commission reports
These sources constitute the global reference baseline for water-related indicators.
Key Quantitative References Used
The following figures illustrate the type of data used to inform WorldWaterChain’s analytical framework:
-
2.2 billion people still lacked access to safely managed drinking water services worldwide*
(UN World Water Development Report 2023; SDG 6 synthesis, UN-Water) -
Over 50% of the global population experiences severe water scarcity for at least one month per year*
(UN World Water Development Report 2021: Valuing Water) -
Approximately 80% of global wastewater is discharged into the environment without adequate treatment*
(UN World Water Development Report 2017: Wastewater – The Untapped Resource) -
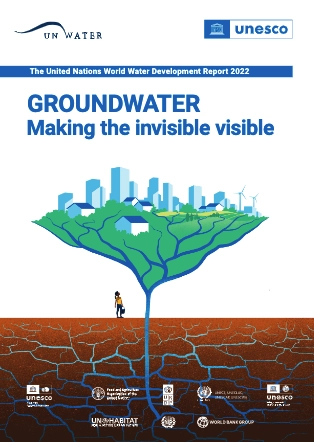
Groundwater supplies nearly 50% of global drinking water and around 40% of irrigation water worldwide*
(UN World Water Development Report 2022: Groundwater – Making the Invisible Visible) -
Climate-related water risks are expected to increase significantly, with water availability variability projected to intensify across most regions*
(UN World Water Development Report 2020: Water and Climate Change)
These figures are not used as isolated statistics, but as structural indicators shaping system-level design choices.
Selection and Interpretation Principles
WorldWaterChain applies a strict methodology when integrating data:
-
Source Authority
Only data produced or endorsed by recognized international institutions are used. -
Temporal Consistency
Preference is given to the most recent editions of recurring reports, while historical series are used to identify trends. -
Cross-Source Validation
Indicators are checked for consistency across multiple reports (e.g., WWDR, SDG, WHO/UNICEF). -
Territorial Relevance
Global indicators are interpreted through a territorial lens, acknowledging regional disparities highlighted in UN regional assessments.
From Indicators to Operational Design
WorldWaterChain does not treat indicators as abstract metrics.
Quantitative data inform:
-
infrastructure design assumptions,
-
decentralization priorities,
-
resilience requirements,
-
and monitoring thresholds.
For example:
-
The documented over-reliance on stressed groundwater resources informs the integration of alternative water production technologies within the framework*
(WWDR 2022) -
The scale of untreated wastewater discharge underscores the need for systems capable of measuring actual outputs and impacts, not just planned investments*
(WWDR 2017)
Transparency and Traceability of Use
WorldWaterChain maintains transparency in how data are used:
-
All references remain attributable to their original institutions.
-
No statistical manipulation or reinterpretation alters the meaning of the source data.
-
Figures are contextualized, not repurposed for promotional narratives.
Where digital tools are used, including blockchain-based mechanisms, their role is limited to:
-
recording operational data,
-
ensuring immutability of records,
-
enabling independent verification.
They do not replace scientific or institutional authority.
Respect for Institutional Sovereignty
WorldWaterChain recognizes that:
-
data ownership remains with source institutions,
-
methodological authority lies with those institutions,
-
and policy interpretation belongs to public and multilateral bodies.
The project positions itself as a technical and operational complement, not as an alternative data producer.
Commitment to Continuous Update
As international reports evolve, WorldWaterChain commits to:
-
updating reference indicators,
-
aligning analytical frameworks with new findings,
-
and maintaining methodological coherence over time.
This dynamic alignment ensures that the project remains consistent with the state of global knowledge, not frozen in static assumptions.
A Foundation for Trust
Transparency is not a communication strategy—it is a structural requirement.
By anchoring its methodology in verifiable data, explicit sources, and clear boundaries of interpretation, WorldWaterChain seeks to establish a foundation of trust essential for:
-
institutional cooperation,
-
responsible investment,
-
and long-term societal impact.
Sources (non-exhaustive):
UN World Water Development Reports (2003–2025), UNESCO / UN-Water
United Nations Sustainable Development Goals Reports (2019–2024)
WHO/UNICEF Joint Monitoring Programme (JMP)
Data Governance & Institutional
Building Trust Through Data Integrity, Transparency, and Verifiable Impact
In an era where global challenges increasingly rely on data-driven decision-making, data governance has become a strategic pillar of public trust.
Across the water sector, international institutions emphasize that the absence of coherent data governance frameworks significantly undermines the effectiveness of policies, investments, and international cooperation.
According to the United Nations World Water Development Report 2023, despite unprecedented volumes of water-related data, institutional fragmentation and weak interoperability between data systems severely limit the ability to translate information into action*.
* Source: UNESCO, United Nations World Water Development Report 2023 – Partnerships and Cooperation for Water, Chapter 6
The Global Data Paradox: Abundance Without Integration
The world today generates more water-related data than ever before.
Yet, over 40% of countries lack integrated water data management systems, resulting in:
-
inconsistent reporting,
-
incomplete monitoring,
-
fragmented databases,
-
and limited comparability across regions.
* Source: UN-Water, SDG 6 Synthesis Report on Water and Sanitation 2023
As a consequence, decision-makers often operate with partial, outdated, or incompatible datasets, reducing their capacity to:
-
anticipate risks,
-
prioritize investments,
-
and evaluate policy effectiveness.
Data Fragmentation as a Structural Barrier
The World Water Development Report 2021 highlights that more than 60% of water-related monitoring programs operate in institutional silos, with limited interoperability between agencies***.
This fragmentation creates:
-
duplicated data collection,
-
inefficiencies in public spending,
-
delays in crisis response,
-
and limited accountability.
* Source: UNESCO, United Nations World Water Development Report 2021 – Valuing Water, Chapter 5
Without unified data governance, financial commitments cannot be systematically linked to:
-
infrastructure deployment,
-
operational performance,
-
and real-world impact.
The Accountability Gap: When Impact Becomes Unverifiable
According to the United Nations World Water Development Report 2020, only 45% of countries possess adequate systems to track water investments through to measurable service delivery*.
* Source: UNESCO, United Nations World Water Development Report 2020 – Water and Climate Change, Chapter 7
This lack of traceability:
-
weakens donor confidence,
-
undermines institutional credibility,
-
and limits public trust.
As water investments increase in scale, the inability to demonstrate verified outcomes becomes a critical risk factor.
Data Governance as a Strategic Lever for Stability
International institutions increasingly recognize that robust data governance frameworks are essential for climate resilience, water security, and geopolitical stability.
The World Water Development Report 2022 stresses that groundwater mismanagement — often linked to weak data governance — affects over 2.5 billion people worldwide*.
* Source: UNESCO, United Nations World Water Development Report 2022 – Groundwater: Making the Invisible Visible, Executive Summary
This highlights the strategic role of:
-
transparent monitoring,
-
reliable reporting,
-
and interoperable data systems.
WorldWaterChain’s Data Governance Framework
WorldWaterChain introduces a multi-layered data governance architecture designed to address these structural challenges.
Its framework is built upon five pillars:
1. Data Integrity
Ensuring that operational data cannot be altered retroactively, preserving factual accuracy and trust.
2. Traceability
Linking financial flows, infrastructure deployment, water production, and service delivery through verifiable records.
3. Interoperability
Designing systems compatible with:
-
public reporting standards,
-
international development indicators,
-
and institutional data infrastructures.
4. Auditability
Enabling third-party verification, independent review, and institutional oversight.
5. Transparency by Design
Making non-sensitive operational metrics publicly accessible to strengthen accountability and public confidence.
Blockchain as an Enabling Infrastructure
Blockchain technologies are integrated selectively within the WorldWaterChain framework as neutral trust layers, enabling:
-
immutable timestamping of water production data,
-
transparent accounting of infrastructure deployment,
-
traceable allocation of financial resources,
-
auditable reporting mechanisms.
This approach aligns with the conclusions of the World Water Development Report 2021, which highlights the urgent need for digital infrastructures capable of reinforcing accountability across water governance systems*.
* Source: UNESCO, United Nations World Water Development Report 2021 – Valuing Water, Chapter 10
Institutional Alignment and Global Standards
WorldWaterChain’s data governance framework is explicitly aligned with:
-
UN Sustainable Development Goal 6 (SDG 6) monitoring indicators
-
UN-Water integrated monitoring framework
-
UNESCO water governance guidelines
-
WHO water quality and service delivery metrics
This ensures full compatibility with international reporting systems and institutional accountability standards.
From Data Governance to Systemic Impact
By structuring data governance as a foundational component rather than an administrative add-on, WorldWaterChain seeks to transform how water initiatives are:
-
designed,
-
financed,
-
implemented,
-
evaluated,
-
and scaled.
The objective is not merely better reporting, but systemic transformation, enabling:
-
faster deployment,
-
more efficient capital allocation,
-
stronger public trust,
-
and sustained long-term impact.